Foreign trade relations
In January-February 2025 legal and natural entities of the Republic of Azerbaijan realized trade operations with their partners in 144 countries of the world, goods were exported to 85 countries and imported from 138 countries.
Taking into account value of statistically estimated exported crude oil and natural gas registered in the customs agencies but customs formalities of which not completed, the foreign trade turnover of the country in January-February 2025 made 8211,2 million USD. 4073,2 million USD or 49,6% of trade turnover made the export value, 4138,0 million USD (50,4%) – import value, and consequently positive trade balance reached to 64,8 million USD. In comparison with January-February 2024, foreign trade turnover increased in actual prices by 27,2% and in real terms - 9,2%. Import increased in real terms by 39,0%, while export decreased by 8,9%.
In January-February 2025 the export of non-oil-gas products made 485,0 million USD and compared to January-February 2024 it increased by 6,6% in actual prices and decreased by 12,6% in real terms.
According to the State Customs Committee data, 25,6% of foreign trade turnover of the country was with Italy, 11,3% – Türkiye, 11,2% – Russia, 8,4% – China, 5,5% - Germany, 2,7% - Australia, 2,6% - the Czech Republic, 2,4% - the United Kingdom, 2,1% - Croatia, 2,1% - Mexico, 2,0% - Romania, 1,7% - Georgia, 1,6% - Greece, 1,5% - Switzerland, 1,5% - Bulgaria, 1,3% - Ireland, 1,3% - Portugal, 1,2% each to Brazil, Iran, USA, 1,1% - Canada, 1,0% - Ukraine, while 9,5% of the trade operations were with other countries.
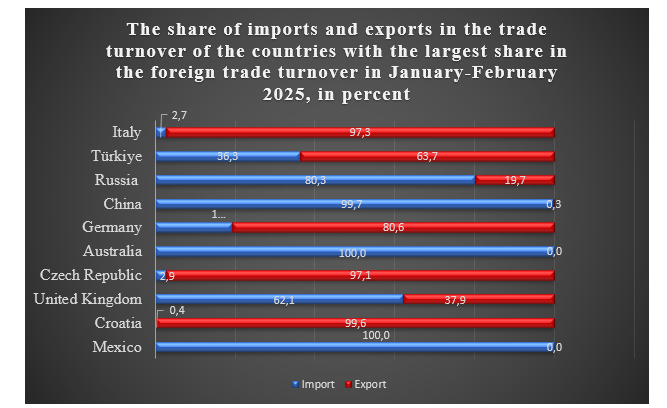
46,3% of exports represented the value of products shipped to Italy, 12,0% to Türkiye, 6,0% to Germany, 4,7% to the Czech Republic, 3,9% to Croatia, 3,5% to Romania, 3,2% to Russia, 2,7% to Georgia, 2,7% to Bulgaria, 2,7% to Greece, 2,3% to Ireland, 2,3% to Portugal, 2,0% to Switzerland, 1,5% to the United Kingdom, 1,0% to Serbia, 0,9% to Ukraine, 0,3% to Kazakhstan, 0,2% each to China, Belarus, USA, 0,2% Israel, United Arab Emirates, 1,0% to other countries.
In the value of non-oil and gas product exports, the share of goods shipped to Russia (31,1%), Türkiye (17,1%), Georgia (10,9%), Switzerland (9,0%), Ukraine (8,5%), Kazakhstan (2,5%), Belarus (2,2%), the USA (2,1%), Israel (2,1%), Germany (1,7%), the United Arab Emirates (1,7%), Turkmenistan (1,3%), Uzbekistan (1,1%), Italy (1,1%) predominated.
20,5% of the total value of imported goods to the country originated from Russia, 17,8% from China, 10,4% from Türkiye, 5,8% from Australia, 4,8% from Germany, 4,5% from Mexico, 3,4% from the United Kingdom, 2,6% from Brazil, 2,5% from Iran, 2,3% each from the USA and Canada, 1,8% from Italy, 1,4% each from Kazakhstan, Uzbekistan and Korea, 1,3% each from Belarus and Japan, 1,1% each from Ukraine and Turkmenistan, 1,0% each from India and Switzerland, and 10,3% from other countries.
In January-February 2025 compared to the same period of the previous year export of main types of products increased as follows: fresh fruits by 23,3%, sugar by 59,3%, fruit and vegetable cans by 9,0%, vegetable oils by 25,6%, tea by 24,9%, mineral fertilizers by 5,4%, cement clinkers by 26,8%, ferrous metal pipes by 81,5%, ferrous metal rods by 43,4%, while the export of fresh vegetables decreased by 0,2%, fruit and vegetable juices by 36,3%, tobacco by 70,9%, margarine and other edible mixtures by 38,6%, natural grape wines and grape must by 27,3%, potatoes by 71,5%, cotton fiber by 26,8%, polypropylene by 25,9%, polyethylene by 1,9%, electricity by 51,7%, unprocessed aluminum by 21,6%, cotton yarn by 18,4%, and bentonite clay by 16,4%.
In January-February 2025 compared to January-February 2024 import of wheat increased by 39,1%, butter, other dairy fats and pastes by 79,8%, raw sugar by 86,8%, tea by 72,9%, potatoes by 0,2%, passenger cars by 27,3%, rolled steel by 30,2%, ferrous metal rods by 2,7-fold, rubber tires by 19,2%, trucks by 6,9%, polyethylene by 13,3%, buses by 4,4-fold, polypropylene by 11,2%, while the import of fresh fruits decreased by 16,9%, chocolate and chocolate products by 9,6%, vegetable oils by 52,5%, flour confectionery by 19,6%, poultry and its by-products by 13,6%, fresh vegetables by 0,8%, beef by 11,1%, pharmaceuticals by 26,4%, ferrous metal pipes by 31,3%, computing machinery, blocks and installations by 18,5%, furniture by 34,3%, synthetic detergents by 20,4%, mineral fertilizers by 7,8%, washing machines by 1,8%, household air conditioners by 6,0%, ferrous metal corners by 2,0%, household refrigerators by 4,1%, cement by 7,2%.
Tel: 377 10 70 (22-60)